KPI & Client Reporting
KPI & Customer Reporting
Real-time Bisiness Intelligence
Review Live Performance Metrics
Collabaro brings together incident data, invoice data and technician time data within Business Intelligence (BI) reports. BI dashboards combine numbers and charts to provide your leadership team with an on-demand summary of how the business is performing today, whilst highlighting any significant trends over time.
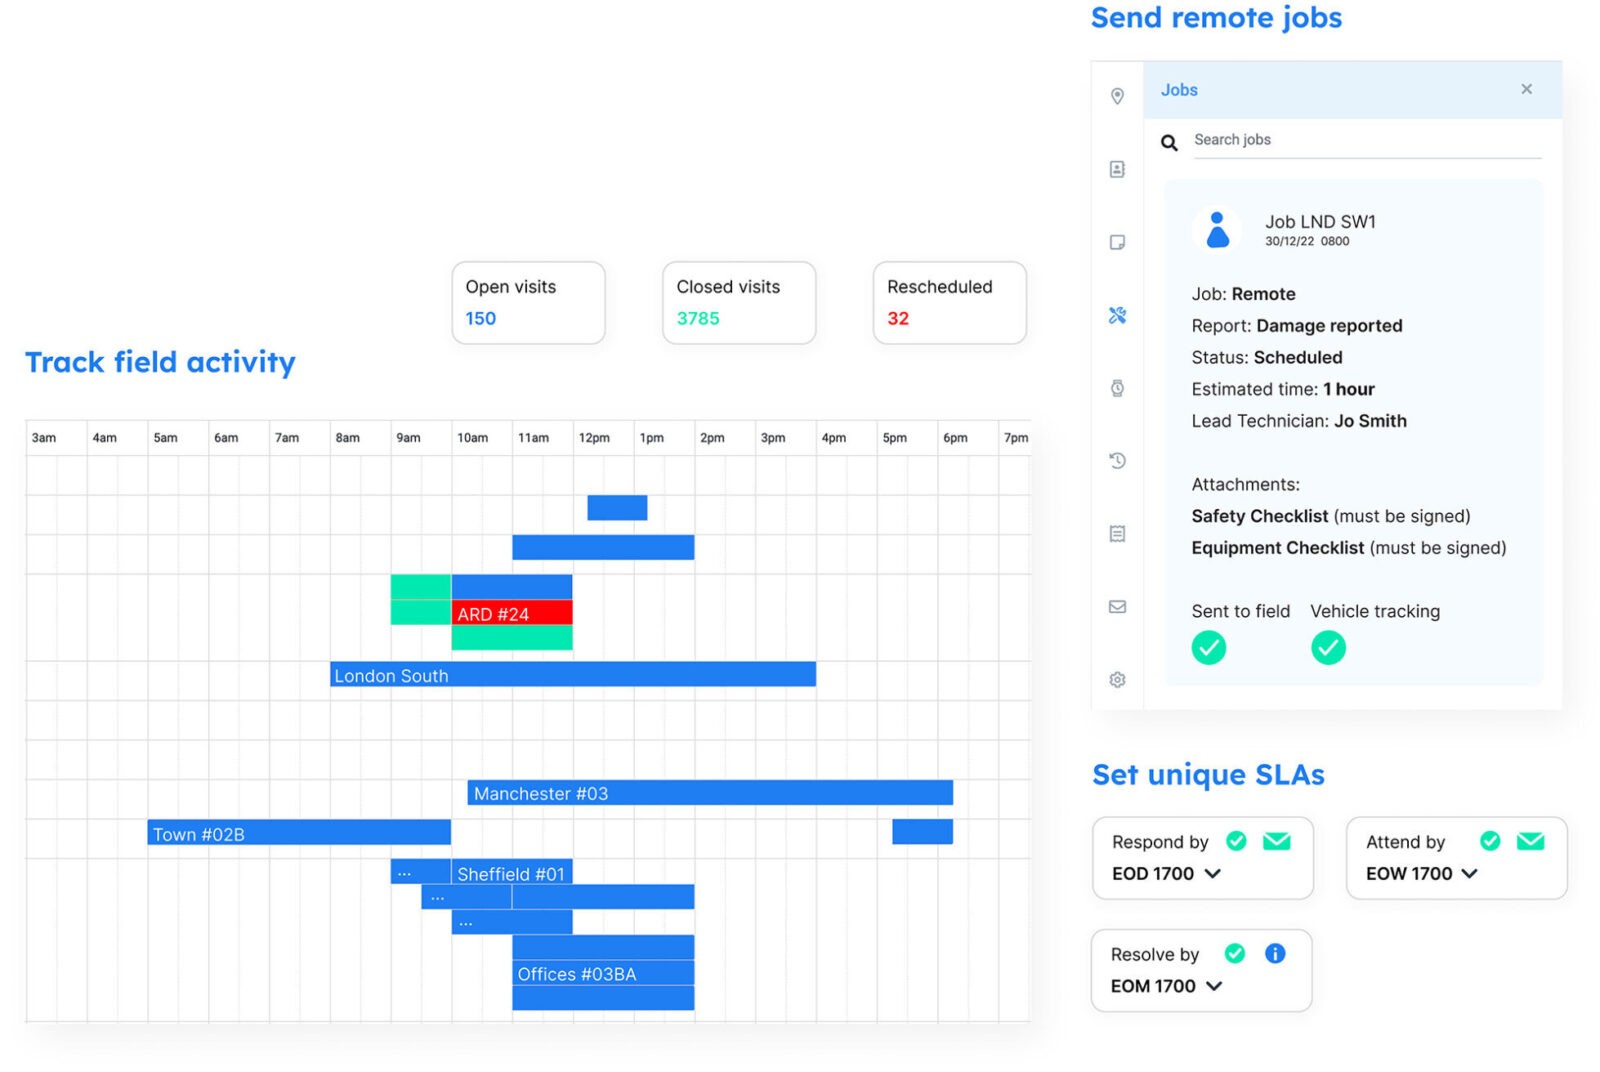
Performance Metrics Include:
1. Counts of incidents, service requests, site visits, remote interventions 2. First-time-fix and SLA met rates 3. Average time to attend and resolve incidents 4. Service revenue per technician hour 5. Service revenue generated each day and month (including work-in-progress and consolidated monthly invoiced work) 6. Technician utilisation % (requires the timesheet module) 7. Planned devices tested per hour 8. Profit margin per a planned maintenance contract These metrics can be applied to customer groups and to branches/depots and can be tracked over time.
Highlight Data Trends Over Time
Visualise data and see patterns where improvements can be made.
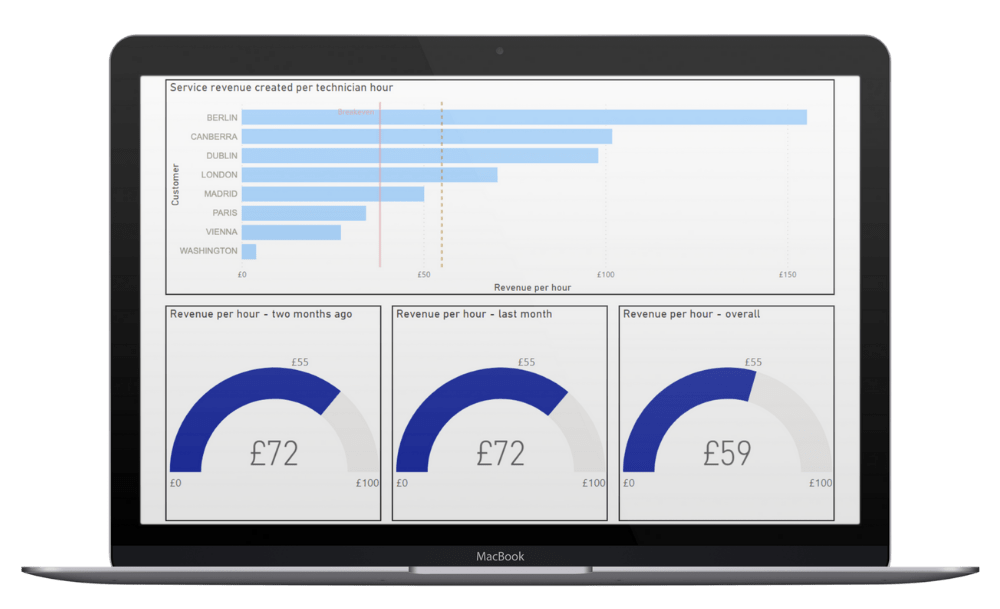
Unlock Valuable Data
Track service revenue per technician hour, and technicians and service controller utilisation.
Review Contract Profitability
Track hours spent versus contract assumptions to calculate profitability and evaluate renewal terms.
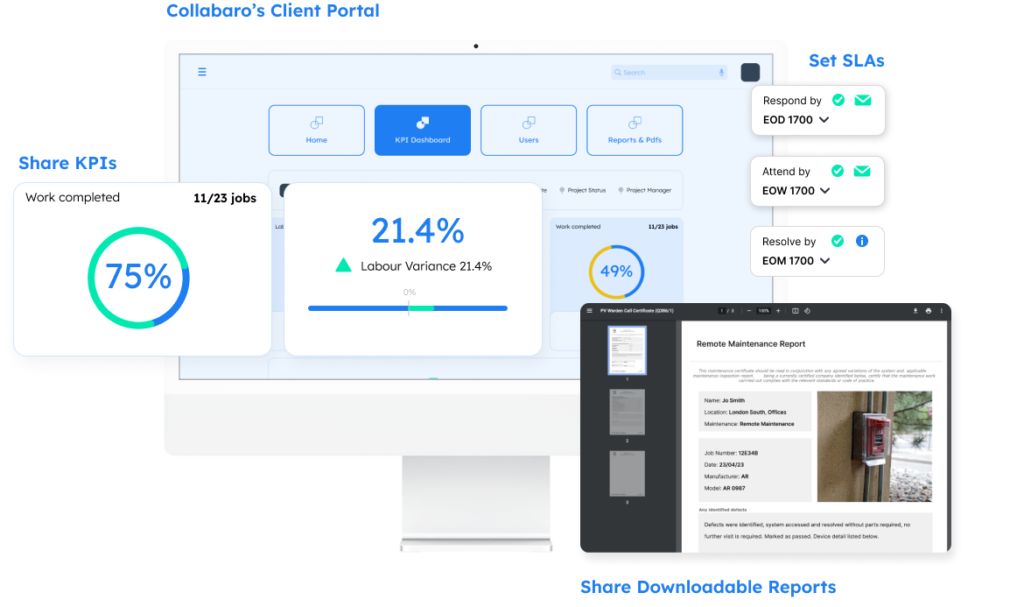
Track Performance
See how you are doing against agreed customer SLAs.
KPI & Customer Reporting
Real-time Bisiness Intelligence
Review Live Performance Metrics
Collabaro brings together incident data, invoice data and technician time data within Business Intelligence (BI) reports. BI dashboards combine numbers and charts to provide your leadership team with an on-demand summary of how the business is performing today, whilst highlighting any significant trends over time.
Performance Metrics Include:
1. Counts of incidents, service requests, site visits, remote interventions 2. First-time-fix and SLA met rates 3. Average time to attend and resolve incidents 4. Service revenue per technician hour 5. Service revenue generated each day and month (including work-in-progress and consolidated monthly invoiced work) 6. Technician utilisation % (requires the timesheet module) 7. Planned devices tested per hour 8. Profit margin per a planned maintenance contract These metrics can be applied to customer groups and to branches/depots and can be tracked over time.
Highlight Data Trends Over Time
Visualise data and see patterns where improvements can be made.
Unlock Valuable Data
Track service revenue per technician hour, and technicians and service controller utilisation.
Review Contract Profitability
Track hours spent versus contract assumptions to calculate profitability and evaluate renewal terms.
Track Performance
See how you are doing against agreed customer SLAs.